



Skymap is a Ruby library for generating maps of the sky.
Warning
This project is in its very early stages, please expect breaking changes.
Install the gem and add it to the application's Gemfile by executing:
bundle add skymapIf Bundler is not being used to manage dependencies, install the gem by executing:
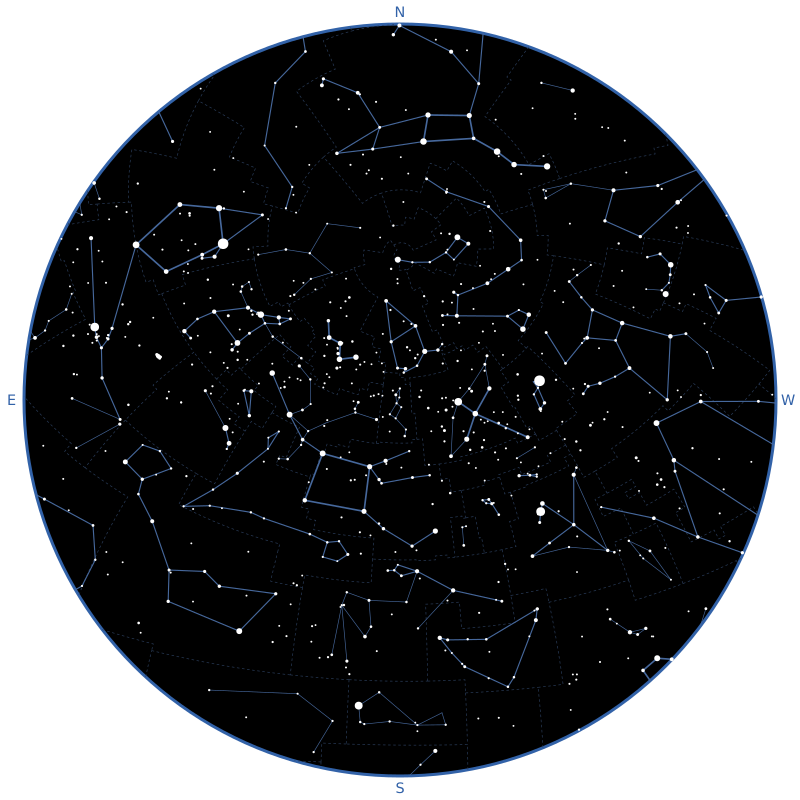
gem install skymapSkymap draws the sky seen by an observer at a given instant, and returns it as an SVG string:
require "skymap"

observer = Astronoby::Observer.new(
  latitude: Astronoby::Angle.from_degrees(48.8575),
  longitude: Astronoby::Angle.from_degrees(2.3514)
)
instant = Astronoby::Instant.from_time(Time.utc(2026, 9, 24, 22))
canvas = Skymap::Canvas.new(size: 800, padding: 24)
stars = Skymap::Catalog::Stars.new.to_a

chart = Skymap::Chart.new(observer: observer, instant: instant, canvas: canvas)
svg = chart.render(
  Skymap::Layers::ConstellationBoundaries.new(
    boundaries: Skymap::Catalog::ConstellationBoundaries.new
  ),
  Skymap::Layers::ConstellationLines.new(
    lines: Skymap::Catalog::ConstellationLines.new,
    stars: stars
  ),
  Skymap::Layers::Stars.new(stars: stars),
  Skymap::Layers::CardinalDirections.new
)

File.write("sky_map.svg", svg)
The observer and the instant are Astronoby objects. Astronoby computes where each star is in the sky and Skymap draws it.
The map is a disk: the zenith is at the center and the horizon is the edge. It uses a stereographic projection, the most common one for sky charts because it keeps the shapes of constellations, even near the horizon. North is at the top and East is on the left, as on a map you would hold above your head.
The canvas is the square SVG the map is drawn on. size is its width and
height, and padding is the space between the horizon and the edge of the
SVG.
A map is the sky, with the layers given to Chart#render drawn on top of it,
in order: each layer is drawn over the previous ones. Without layers,
Chart#render draws an empty sky. Leave a layer out to hide what it draws.
Skymap::Layers::Stars draws stars, bigger the brighter they are.
Skymap::Catalog::Stars gives the 9,096 stars of the Yale Bright Star
Catalogue (see Data sources), but the layer accepts any list
of Skymap::Star.
By default, only stars of magnitude 5 or brighter are drawn, which is about
what you can see from a suburban sky. Use magnitude_limit: to draw more or
fewer stars:
Skymap::Layers::Stars.new(stars: stars, magnitude_limit: 6)Skymap::Layers::ConstellationBoundaries draws the boundaries between the
constellations as thin dashed lines, and stops the ones that cross the horizon
at the edge of the sky. Skymap::Catalog::ConstellationBoundaries gives the
borders of the 88 IAU constellations (see Data sources).
Layers are drawn in the order they are given: put the boundaries first to draw them below the lines and the stars.
Skymap::Layers::ConstellationLines draws the lines of the constellations.
Skymap::Catalog::ConstellationLines gives the lines of the 88 IAU
constellations (see Data sources).
Figures are drawn whole, even when some of their stars are fainter than the magnitude limit of the stars layer, and lines that cross the horizon stop at the edge of the sky. The stars given to the layer must include the stars of the lines: lines to a star that is not given are left out.
Each line has a weight, as drawn on the IAU charts: bold for the best-known
shapes (the asterisms, such as the Big Dipper or the Teapot of Sagittarius),
normal for the rest of the figures and thin for the secondary lines. The
layer draws the lines it's given, so select the ones you want, for example
only the asterisms:
asterisms = Skymap::Catalog::ConstellationLines.new.select do |line|
  line.weight == :bold
end

Skymap::Layers::ConstellationLines.new(lines: asterisms, stars: stars)Skymap::Layers::ConstellationNames writes the name of each constellation in
the middle of its stars. It takes the same lines and stars as the
constellation lines layer, since the lines tell which stars belong to which
constellation:
lines = Skymap::Catalog::ConstellationLines.new.to_a

Skymap::Layers::ConstellationNames.new(lines: lines, stars: stars)
Reading the lines into an array with to_a, once, saves the layers from
reading the file again each.
A constellation is named when more than half of its stars are above the horizon. When its figure is in several parts, such as Serpens, the name goes in the middle of the biggest part that is above the horizon. Mensa and Microscopium have no lines, so they have no name on the map.
The names are in English, from Skymap::Catalog::ConstellationNames. Use
names: to write them differently: it takes anything that gives a name from
the IAU abbreviation of a constellation, such as a hash. A constellation
without a name is left out:
Skymap::Layers::ConstellationNames.new(
  lines: lines,
  stars: stars,
  names: {"UMa" => "Grande Ourse", "UMi" => "Petite Ourse"}
)Skymap::Layers::Moon draws the Moon where it is in the sky, with its phase.
The Moon is drawn upright, as the observer sees it from the ground, so a
crescent over the western horizon is tilted as it is in the real sky. On the
chart, this means the lit side does not always face the Sun's position.
Astronoby needs an ephemeris to compute where the Moon is: download one once, load it and give it to the layer (see the Astronoby documentation to pick one):
Astronoby::Ephem.download(name: "inpop19a.bsp", target: "inpop19a.bsp")
ephem = Astronoby::Ephem.load("inpop19a.bsp")

Skymap::Layers::Moon.new(ephem: ephem)
The Moon is drawn larger than it is, as on most sky maps: at its true size it would be a dot as small as the faintest stars. Its radius is 3% of the radius of the sky. When the center of the Moon is below the horizon, it is left out.
Skymap::Layers::Sun draws the Sun where it is in the sky. Like the Moon, it
needs an ephemeris (see Moon):
Skymap::Layers::Sun.new(ephem: ephem)The Sun is drawn larger than it is, at the same size as the Moon: 3% of the radius of the sky. When the center of the Sun is below the horizon, it is left out.
Skymap::Layers::Planets draws the planets, from Mercury to Neptune, where
they are in the sky. They need an ephemeris too (see Moon). A planet
is drawn as a star would be, bigger the brighter it is, with a warm tint so it
stands out from the stars:
Skymap::Layers::Planets.new(ephem: ephem)As for the stars, only planets of magnitude 5 or brighter are drawn by
default, which leaves out Uranus and Neptune. Use magnitude_limit: to draw
more or fewer planets. The magnitude of a planet changes over time, so a
planet can come in and out of the map:
Skymap::Layers::Planets.new(ephem: ephem, magnitude_limit: 6)Planets below the horizon are left out.
Use labels: true to write the name of each planet next to it, on the side of
the center of the map so it stays inside the sky:
Skymap::Layers::Planets.new(ephem: ephem, labels: true)The names are in English. Use names: to write them differently, with a hash
of the planets (:mercury, :venus, :mars, :jupiter, :saturn,
:uranus and :neptune). A planet without a name is drawn without it:
Skymap::Layers::Planets.new(
  ephem: ephem,
  labels: true,
  names: {saturn: "Saturne", jupiter: "Jupiter"}
)Skymap::Layers::Ecliptic draws the ecliptic, the line the Sun follows in the
sky over a year. The Moon and the planets are always close to it. It needs no
data, and it stops at the horizon:
Skymap::Layers::Ecliptic.newSkymap::Layers::CardinalDirections labels the cardinal directions (N, E, S,
W) in the padding, with a size that follows it: a padding of about 3% of the
size gives readable labels.
data/stars.csv is extracted from the Yale Bright Star Catalogue, 5th
Revised Edition (VizieR V/50): the 9,096 stars of the catalog with
their Harvard Revised number (hr), J2000 coordinates (right_ascension in
hours, declination in degrees) and visual magnitude (magnitude). The 14
non-stellar entries kept only for numbering are left out.
Hoffleit, D., Warren Jr., W. H., 1991, The Bright Star Catalogue, 5th Revised Ed. (Preliminary Version), Astronomical Data Center, NSSDC/ADC.
The file is generated with bin/build_catalog, which downloads the catalog
from CDS.
This research has made use of the VizieR catalogue access tool, CDS, Strasbourg, France (DOI: 10.26093/cds/vizier). The original description of the VizieR service was published in 2000, A&AS 143, 23.
data/constellations/iau/lines.csv holds the lines of the 88 IAU
constellations (Mensa and Microscopium have none), one row per segment:
constellation: the IAU abbreviation of the constellation.from_hr,to_hr: the ends of the segment, as HR numbers of stars ofdata/stars.csv. An end with two HR numbers, such as5190 5193, is the midpoint of these two stars: the IAU charts draw some lines to a pair of close stars rather than to one of them.weight:boldfor the lines the charts draw thickest, the best-known shapes such as the Big Dipper or the Teapot of Sagittarius,normalfor the rest of the main figures,thinfor the secondary lines.
The lines are transcribed from the IAU constellation maps of the IAU Office of Astronomy for Education, adapted from the original charts by the IAU and Sky & Telescope magazine (Roger Sinnott & Rick Fienberg), with the constellation patterns of Alan MacRobert, and released under the Creative Commons Attribution 4.0 International license.
The file was transcribed once from the vector PDF of each map, by matching the ends of the lines drawn on the maps to the stars of the catalog, and checked against the maps. It is not regenerated by a script.
data/constellations/iau/names.csv gives the English name of each of the 88
IAU constellations from its IAU abbreviation, as listed by the International
Astronomical Union.
data/constellations/iau/boundaries.csv holds the borders between the 88 IAU
constellations, one row per point of a border, in order:
border: the number of the border. Each border between two constellations is listed once.constellations: the IAU abbreviations of the two constellations the border separates.right_ascension(hours) anddeclination(degrees): the coordinates of the point, in J2000. The borders of the constellations are straight lines of right ascension and declination in B1875, and curves in J2000: there is a point about every degree to follow them.
The borders come from the Catalogue of Constellation Boundary Data by Davenhall and Leggett (VizieR VI/49), in the version of Bill J. Gray that lists the constellation on each side of a border. They are the boundaries defined by Delporte in 1930, in B1875 coordinates.
Davenhall, A. C., Leggett, S. K., 1989, Catalogue of Constellation Boundary Data, Royal Observatory Edinburgh.
The file is generated with bin/build_boundaries, which downloads the
catalog from CDS, keeps each shared border once, adds the points along the
borders and precesses them to J2000 with Astronoby.
The tests of the Sun, the Moon and the planets use
spec/fixtures/de440s_2025_2030_excerpt.bsp, an excerpt of DE440s, the
planetary and lunar ephemeris of the Jet Propulsion Laboratory,
distributed by NAIF. It only keeps the barycenters of the planets, the
Sun, the Moon and the Earth, from 2025 to 2030. As NAIF asks for modified
kernels, its comment area names this project as the last to modify it, and
points to the original kernel. It is not part of the gem.
Park, R. S., Folkner, W. M., Williams, J. G., Boggs, D. H., 2021, The JPL Planetary and Lunar Ephemerides DE440 and DE441, The Astronomical Journal, 161, 105.
After checking out the repo, run bin/setup to install dependencies. Then, run
bundle exec rake to run the tests and the linter. You can also run
bin/console for an interactive prompt that will allow you to experiment.
- Tests:
bundle exec rspec - Linter (Standard Ruby through RuboCop):
bundle exec rubocop(bundle exec rubocop -ato autocorrect) - Everything CI checks:
bin/ci
- Update the version number in
lib/skymap/version.rbandCHANGELOG.md. - Commit, then tag and push:
git tag vX.Y.Z && git push origin vX.Y.Z. - The Release workflow builds and publishes the gem to RubyGems.org using trusted publishing.
Bug reports and pull requests are welcome on GitHub at https://github.com/rhannequin/skymap. This project is intended to be a safe, welcoming space for collaboration, and contributors are expected to adhere to the code of conduct.
The gem is available as open source under the terms of the MIT License.
Everyone interacting in the Skymap project's codebases, issue trackers, chat rooms and mailing lists is expected to follow the code of conduct.